Real Clear Daf, one of our non-profit clients, approached us wanting to understand better how many people were using the information on their site provided. Offering a daily podcast through both the website interface and an app, he wanted a better of understanding of how many people were listening and how often they were listening for.
Of course, we can use basic Google Analytics to see data like Users, Average Time on Site, and other basic usability metrics. However, interactions with the podcast interface weren’t captured. So, our task was to figure out how to best measure these interactions and display them in a simple, actionable way.
We ended up implementing event tracking via Google Tag Manager with a logical, planned data structure that made user actions easy to categorize, organize, and understand. Our client received real-time data via Google Data Studio and Google Analytics, allowing him to identify and increase interaction with his most loyal users.
Real Clear Daf knew how many people went to their website, where they came from, and how long they stayed – all very valuable things when it came to raising money for the project. However, they didn’t have an understanding of how people actually interacted with the podcast. They wanted to know who was listening, for how long, and using which interface. Better understanding how people used their site effectively would allow them to make it better while arming them with impressive engagement data to promote to donors.
Through our Google Grants work with the client, we had already set up Google Tag Manager and had all tracking scripts running through it. We were ready to use that implementation to help take the tracking further.
An effective tracking strategy needs to be organized and documented. Our process started by listing the client’s needs and auditing the website for everything we would want to track (image 2). With this spreadsheet, we identify solutions and discuss the most effective way of implementing. We then design a naming structure to keep event and page tracking organized (and easy to use for reporting and filtering purposes). Then, we implement the tracking via GTM, set up goals, and then monitor to make sure everything is tracking successfully.
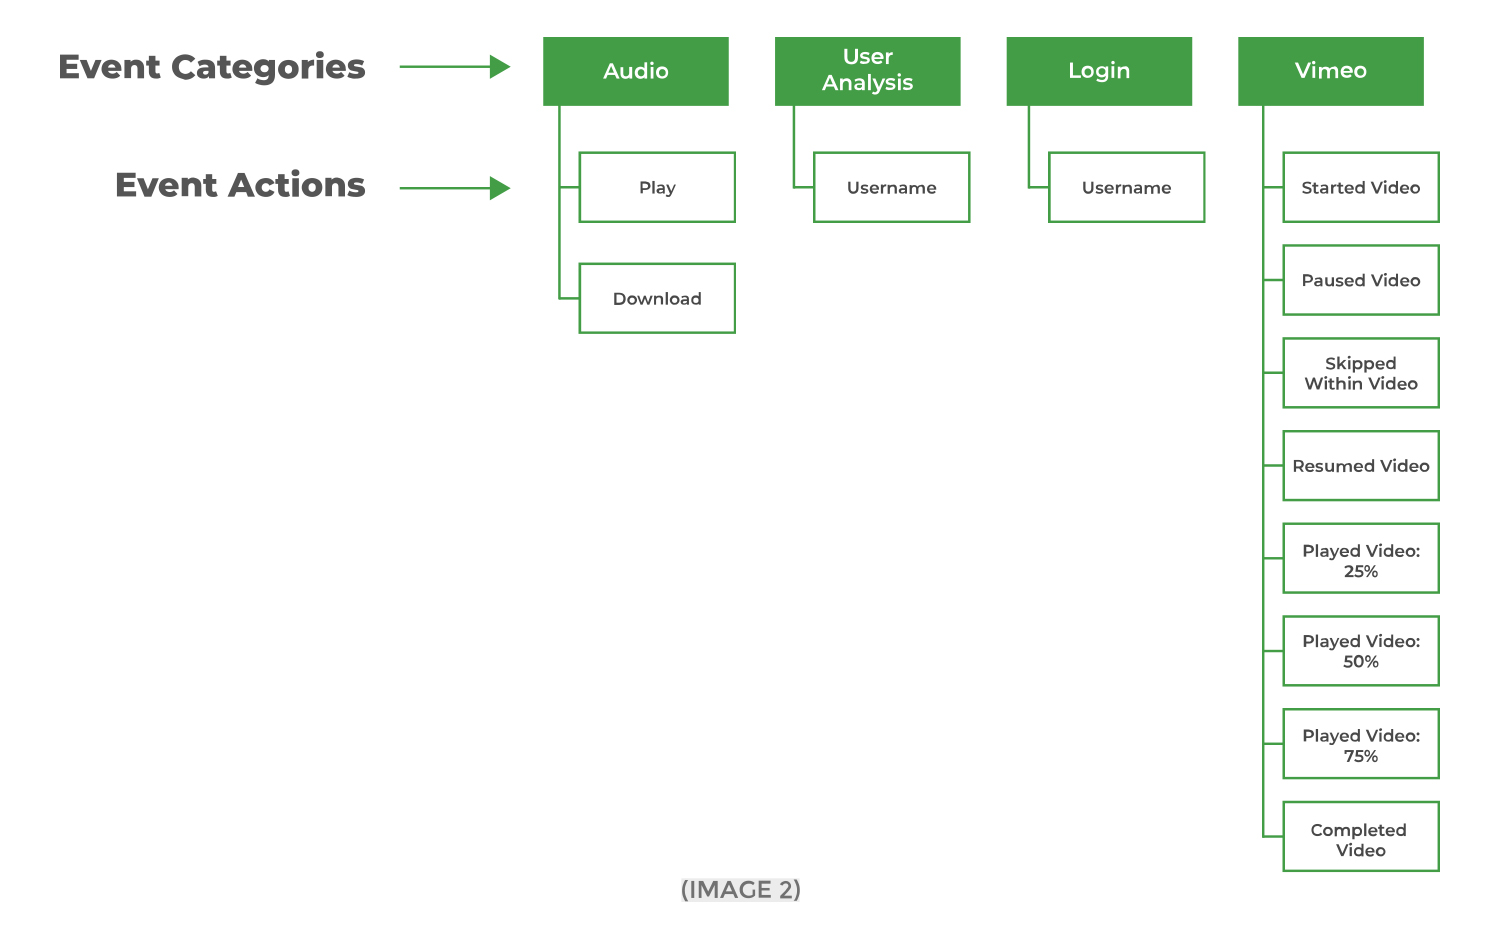
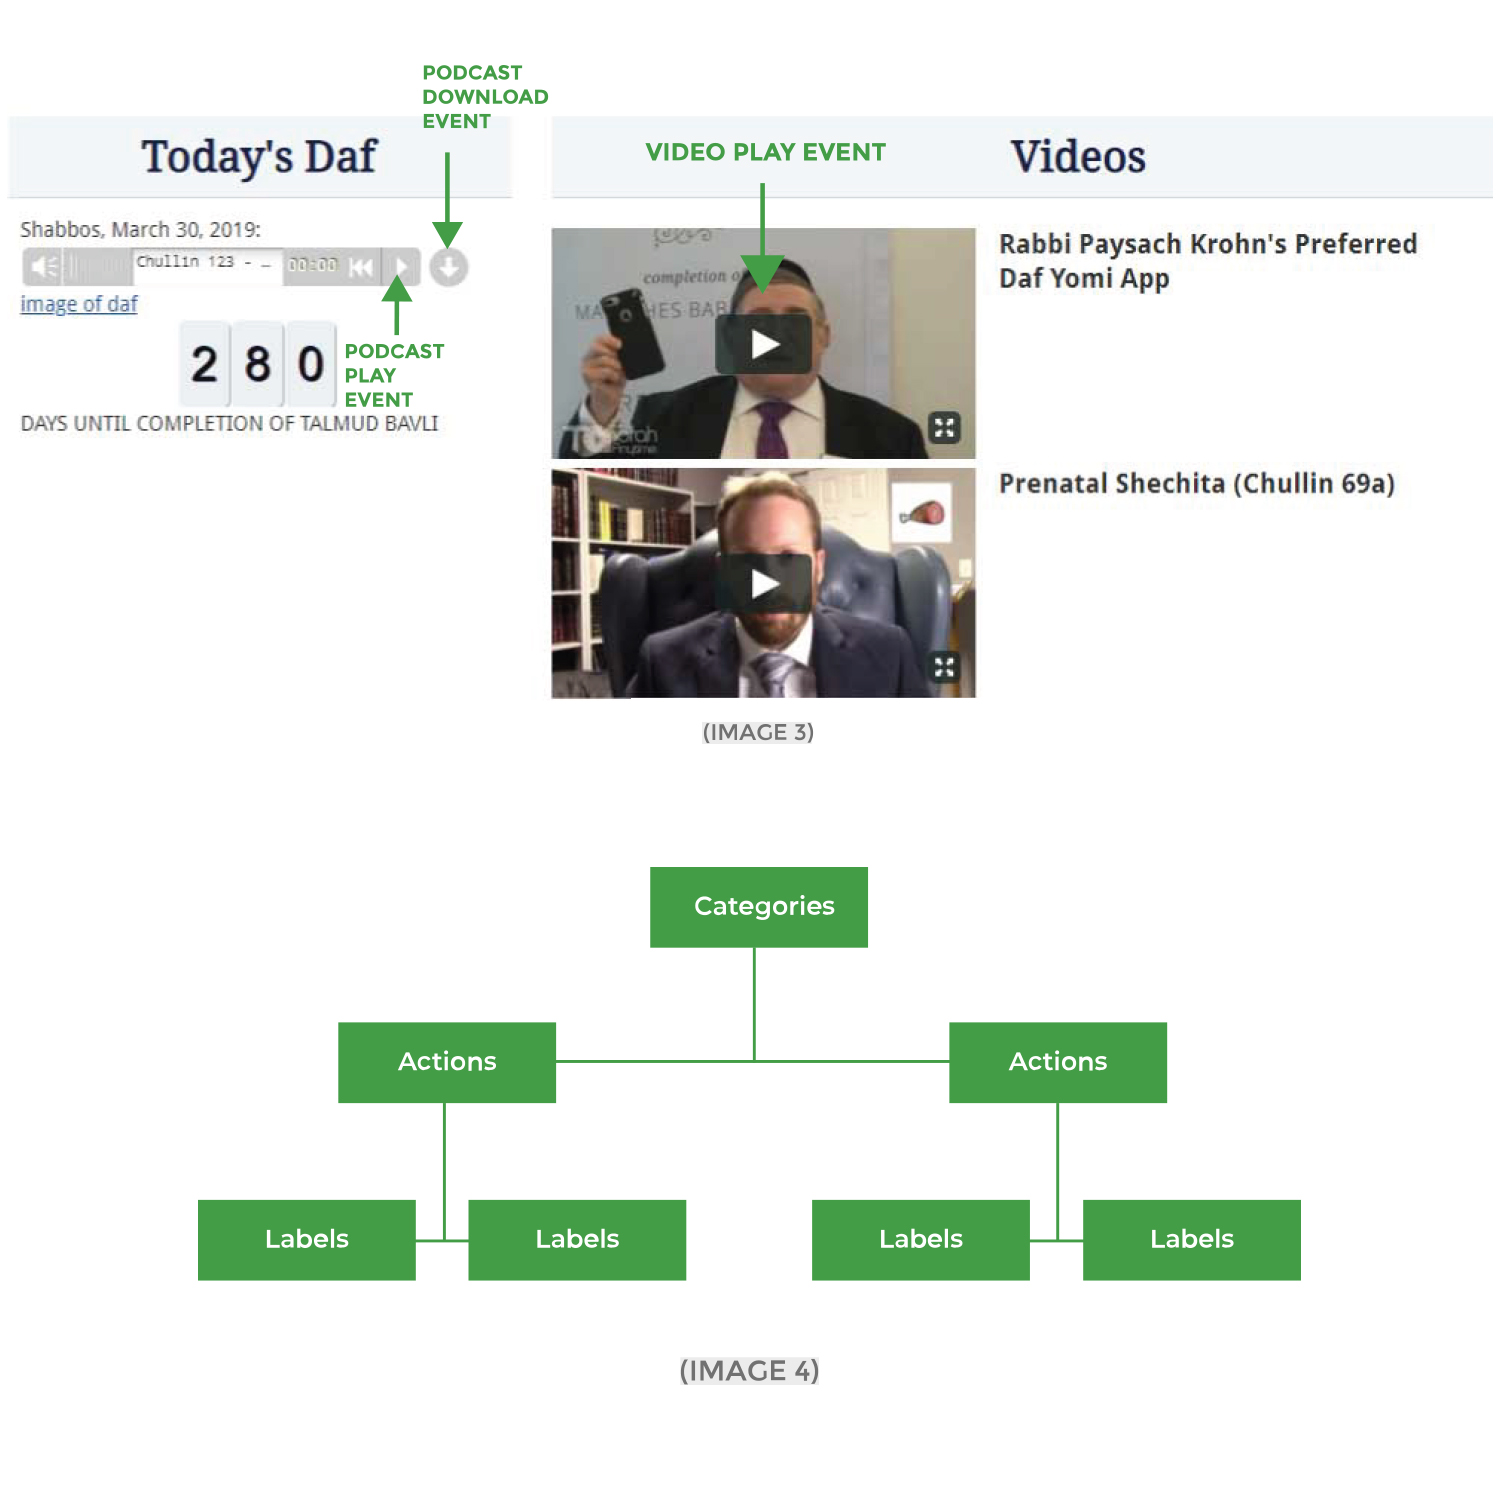
In this case, most of our work was focused around timing events and user logins. These all required event tracking, which we developed to track stops, starts, length of play, where users were listening to the podcasts, or if they were downloading them (image 3).
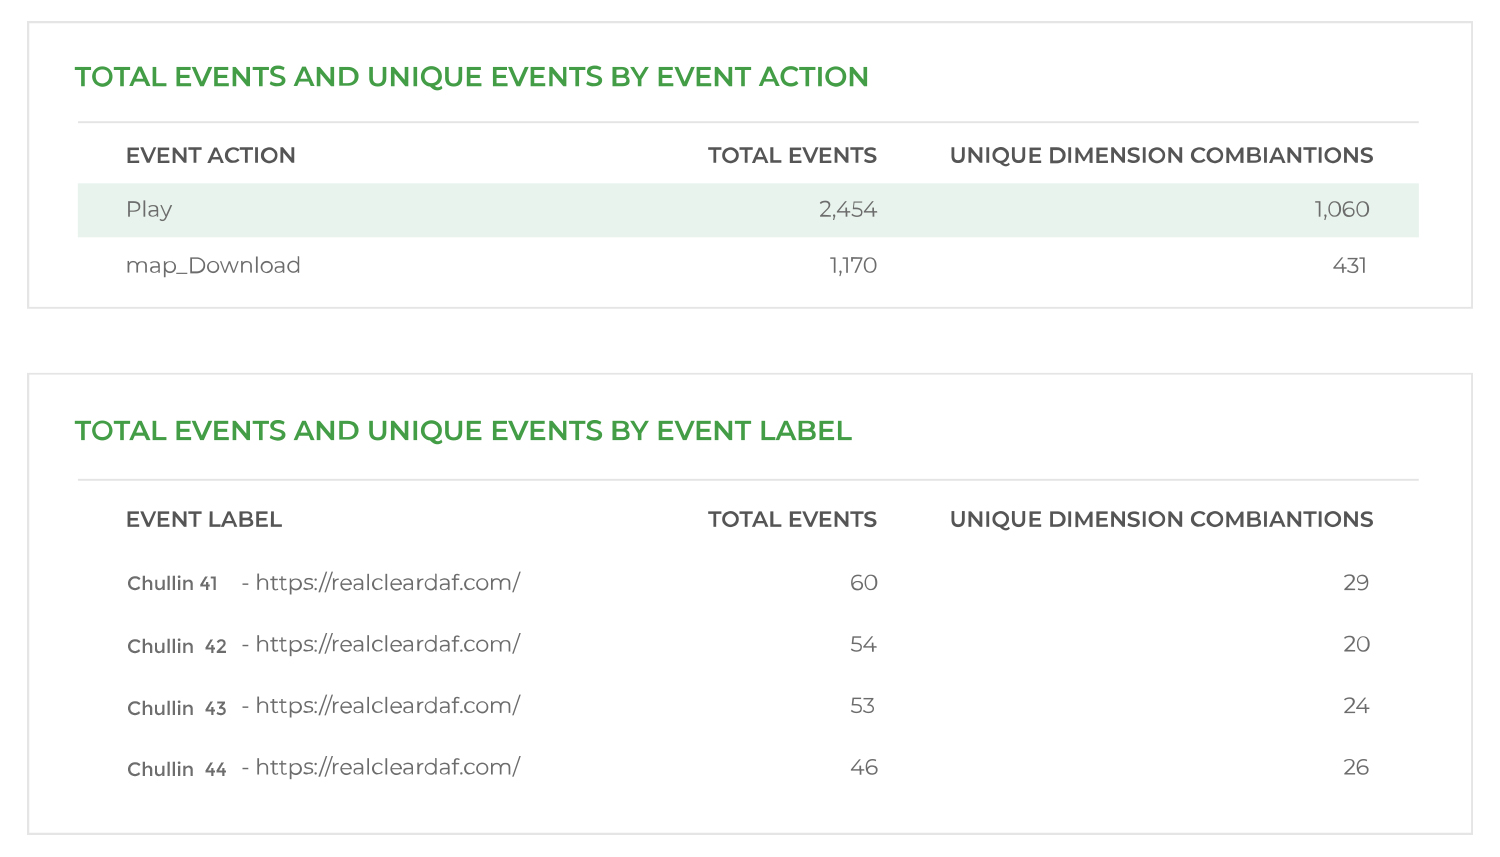
Using a structured naming convention (image 4), we implemented via GTM so many variables could be easily filtered and segmented to look at pieces of data. This was especially important when creating custom reports, dashboards, and real-time analytics to make sure the proper segments were displayed to our client.
Data could easily be sorted and filtered by username, podcast, and location. Our clients were able to identify active users and when they were using the website most often, giving them the ideal time to reach out for support (image 5).
Complete data was easily available about the amount of engagement, number of interactions, where users were interacting, and detailed user data that summarized how people used the website.
This additional information was invaluable for our clients, who were able to tell a much better story about their project and how many people were finding it meaningful.
It's time to take your digital marketing to the next level. Whether you need a little help or a lot, our team will help you execute a comprehensive digital marketing strategy.


